Overview of the Reports Module
The Reports module allows you to view a variety of existing reports that have either been previously created from the ChangeGear Desktop Client or created from the ChangeGear Web Based Report Designer. The types of reports listed in the report module are table reports, bar chart, pie chart, line chart, gauge charts and score cards.
These reports can also be displayed in the Dashboard or Workspace by creating the appropriate Workspace or Dashboard widget and applying the report to that widget.
Group Menu
Use the categories in the left navigation menu to select which reports display in the Reports Grid. Using the My Reports group menu, you can view your own custom reports.
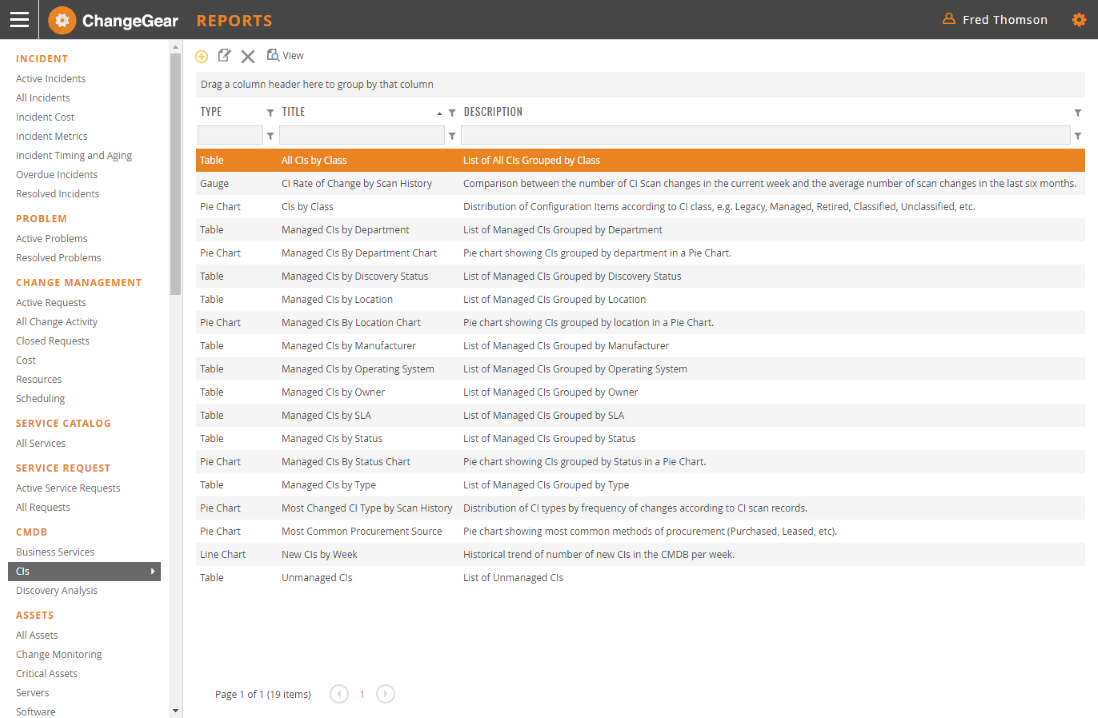
Reports Grid
This section of the Reports module provides a detailed list of the reports available associated with the category you selected in the Navigation Bar.